Fdrandom.js
Fast deterministic javascript random methods. Includes uniform, gaussian, various loaded distributions and Shuffles.
66 Test Charts
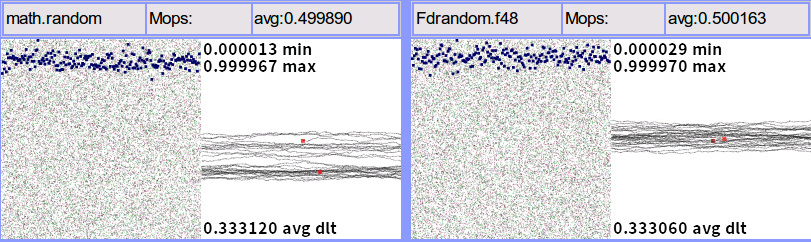
Lefthand charts:
50 thousand results are plotted as 25 thousand 2D points. Each point is drawn a different hue, which cycles through 14 values. 14 is a multiple of Fdrandom's state space of 7 ~50 bit numbers. The drawing transparency also increases through duration of the plot. These effects can render potential non-random patterning which might otherwise not be made visible. A histogram of the functions distribution is superimposed on the chart in blue.
Righthand Charts:
A random walk is drawn with 800k points, each point is moved in X & Y axis by consecutive variates and a horizontal drift is added to traverse the chart 32 times on average. Red dots mark the beginning and end of the walk. Min and max values out of 32k samples and the average delta between sequential variates are printed on the righthand chart.
Notes
These charts are made to display the functions performance and distributions and spot potential bias or patterns. The zrange function is made to produce erratic changing distributions. The blue histogram and drift charts include less samples than the 2D charts.
Unexplained patterning can be seen in cauchy output, this does not seem due to the generator as even browser cyptos generator can create it. Seems something to do with the extreme range which cauchy produces...
The final charts examine the results of the quasi-random 'antisorting' shuffle on flat and coarsely distributed array contents. The distrubition of the standard random shuffle function 'mixup()' is also checked.
The very last chart has gthorn drawing a fuzzy circle with consecutive values, by stepping a target of PI/2 inside Math.sin: function(){return Math.sin(x+=Fd.gthorn(0,Math.PI))}